Introduction: Unlock the Power of Mean, Median, and Mode
When you hear the word “average,” it’s often referring to the mean, but there are two other essential measures you should know about—median and mode. These three measures are fundamental to understanding data, and they help you draw meaningful insights, whether you’re analyzing sales figures or tracking your social media press releases.
As a small business owner, entrepreneur, or PR professional, understanding how to calculate the mean, median, and mode is crucial. They’ll help you make better decisions, whether you’re working on local press releases and media coverage or evaluating the performance of a press release social media post.
Let’s break down these concepts in simple terms and show you exactly how to find the mean, median, and mode in your data!
What is the Mean?
The mean is what most people refer to as the “average.” To find the mean, you add up all the numbers in your data set and divide that sum by the total number of values. The mean gives you a good idea of the overall trend, especially when the data is evenly distributed.
Example:
Imagine you’re a digital marketer looking at the number of views each of your press releases and social media posts received. Your numbers are:
- 15, 20, 35, 40, 60
To find the mean, follow these steps:
- Add up the numbers:
15 + 20 + 35 + 40 + 60 = 170 - Divide by the total number of values:
170 ÷ 5 = 34
So, the mean number of views is 34.
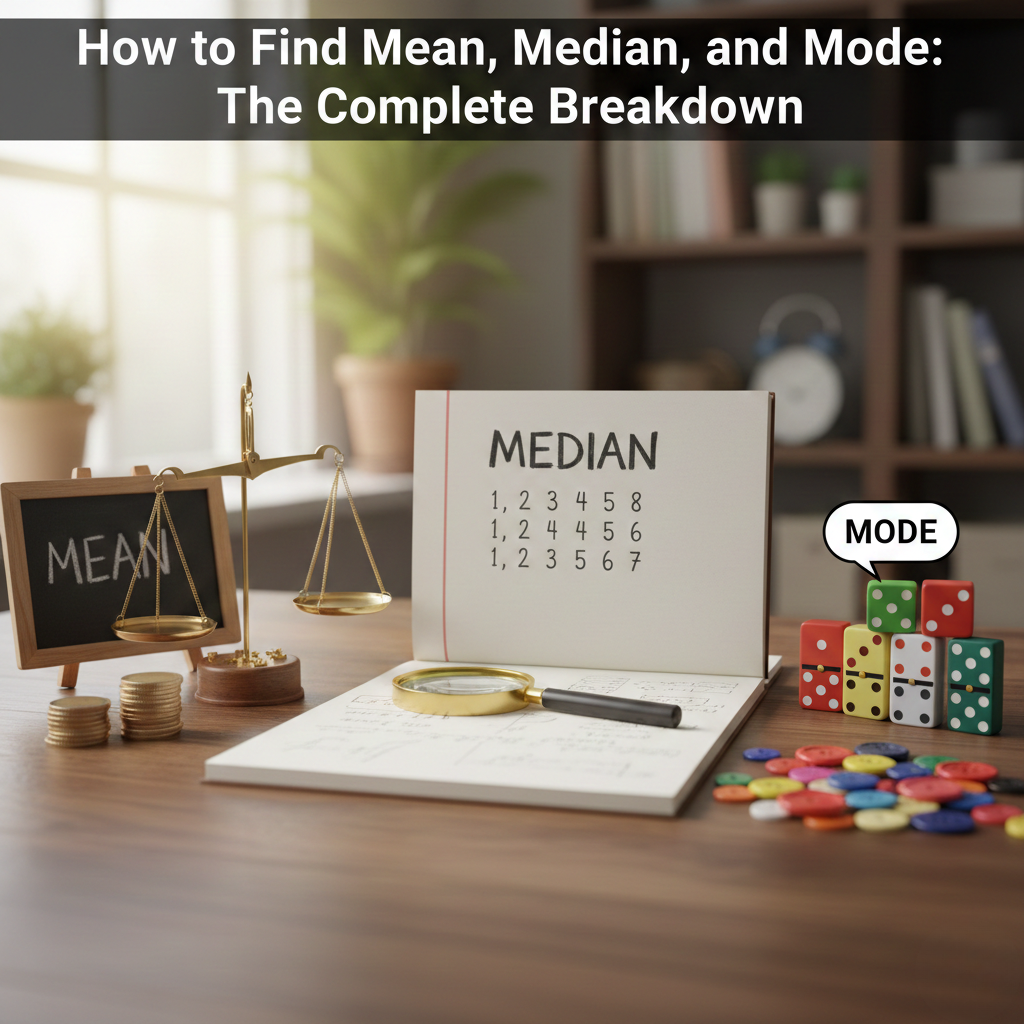
What is the Median?
The median is the middle value in your data set when the numbers are arranged in order. If the data set has an odd number of values, the median is the middle number. If the data set has an even number of values, the median is the average of the two middle numbers.
Example:
Let’s use the same set of numbers for the median:
15, 20, 35, 40, 60
- Arrange the numbers in order (if they aren’t already):
15, 20, 35, 40, 60 - Find the middle value:
The middle value is 35, so the median is 35.
For an even data set, like:
4, 10, 15, 20
- Arrange the numbers in order:
4, 10, 15, 20 - Average the two middle numbers:
(10 + 15) ÷ 2 = 12.5
What is the Mode?
The mode is the number that appears most frequently in your data set. Unlike the mean and median, the mode can have more than one value if there are multiple numbers that appear with the same frequency.
Example:
Let’s say you’re analyzing the number of times certain topics are mentioned in your press releases and social media posts. The numbers are:
- 5, 10, 15, 10, 5, 5, 20
The mode is 5 because it appears the most frequently (three times).
If you had the numbers:
- 5, 10, 15, 10, 15, 5, 20
Then, both 5 and 10 would be the modes because they appear the same number of times.
How to Find the Mean, Median, and Mode: A Step-by-Step Guide
Now that you understand what the mean, median, and mode are, let’s break down how to calculate them:
Step 1: Find the Mean
- Add all the numbers together.
- Divide the sum by the total number of numbers in the data set.
Step 2: Find the Median
- Sort the numbers in ascending order.
- Find the middle value.
- If there’s an odd number of values, the median is the middle number.
- If there’s an even number of values, the median is the average of the two middle numbers.
Step 3: Find the Mode
- Identify the number that appears most often in the data set. If there’s no repeating number, the data set has no mode.
When to Use the Mean, Median, and Mode
Now that you know how to calculate these measures, let’s discuss when to use each one in practice, particularly in business and marketing scenarios:
1. Use the Mean for Symmetrical Data
When your data is roughly symmetrical, use the mean to find the “average.” For example, if you’re analyzing local press releases and media coverage across different channels, the mean can help you understand overall performance when the results aren’t skewed by outliers.
2. Use the Median for Skewed Data
When your data has outliers or is skewed, use the median. For instance, if you’re analyzing press releases on social media where a few posts went viral but most didn’t perform as well, the median gives a better idea of the “typical” engagement level.
3. Use the Mode to Identify Trends
The mode helps you spot trends and patterns, especially in frequency-based data. If you’re tracking the types of topics that generate the most buzz in your social media press releases, the mode can help identify which topics are the most popular with your audience.
Real-World Applications of Mean, Median, and Mode
Here are some practical examples of how mean, median, and mode are used in real-world scenarios:
1. In Business
As a local business owner or entrepreneur, you may use the mean to track average sales, the median to understand typical customer purchases (avoiding extreme high or low values), and the mode to determine which products are sold most frequently.
2. In Marketing and PR
For PR professionals, using the median to analyze social media press releases can help you gauge the performance of your posts without being misled by a few viral hits. On the other hand, the mode can help you identify the most popular hashtags, topics, or formats for your press releases and social media.
3. In Education
In education, teachers use these measures to assess students’ performance. The mean provides an overall average grade, the median helps avoid skewed results caused by a few extremely high or low scores, and the mode identifies the most common test scores.
How to Send Press Releases to Local Media
If you’re ready to apply the power of statistics to your press release media kit, the next step is sending your press release to the right local outlets. Here’s how you can effectively submit your press release:
- Build a Media List: Research local journalists, news outlets, and blogs that cover topics relevant to your press release.
- Craft a Strong Pitch: Personalize your message to make it stand out. Be clear about why your press release matters to their readers.
- Use Distribution Services: Platforms like PR Newswire help you expand your reach by distributing your press release to multiple outlets.
FAQs
Q1: What’s the difference between media advisory vs press release?
A1: A media advisory invites media to cover an event, while a press release provides detailed information about an event, product, or announcement.
Q2: How do I find the median?
A2: Sort your data in order, and find the middle number. If there’s an even number of values, average the two middle numbers.
Q3: How do I use the mode?
A3: The mode is the most frequent number in your data. Use it to identify the most popular trends or frequent outcomes in your data set.
Conclusion: Make Smarter Decisions with Mean, Median, and Mode
Understanding how to find the mean, median, and mode is essential for making data-driven decisions. Whether you’re analyzing your press releases on social media or tracking the performance of your local media coverage, these measures give you the tools to spot trends, avoid errors, and draw actionable insights.
Ready to start analyzing your data? Use these concepts to track your marketing performance, understand customer behavior, and make smarter decisions for your business.
For more helpful tips, explore our other resources: